Value Chain Analysis: A Practical Guide for Consultants

Value chain analysis breaks a business into activities to show where it creates customer value, incurs costs, and builds competitive advantage. For consultants, it connects operational evidence to decisions about what a client should improve, protect, outsource, or stop.
The useful output is a set of strategic trade-offs, backed by costs and customer evidence. These trade-offs show how activity choices affect value creation and reinforce competitive advantage. Start with the client decision, then trace the activities that influence it.
What value chain analysis tells a client
Michael Porter developed the framework in 1985 and described it in Competitive Advantage. Porter’s value chain framework examines strategically relevant activities and the connections between them.
Clients can use the value chain as a strategic framework to identify activities that strengthen competitive advantage.
Porter identifies two paths: cost leadership and differentiation. A company can deliver comparable value at lower cost, or create distinctive value that supports a price premium.
Consultants use the framework during strategic planning, cost reduction, digital transformation, market entry, mergers and acquisitions, and performance improvement.
Before collecting data, ask:
- Which decision must this analysis support?
- Which customer segment and product or service are in scope?
- Where do customers experience delays, defects, or benefits worth paying for?
Define the margin measure, geography, and operating boundary too. Clear consulting scope and deliverables prevent a focused diagnostic from expanding into an unplanned implementation project.
Break down Porter’s nine activities
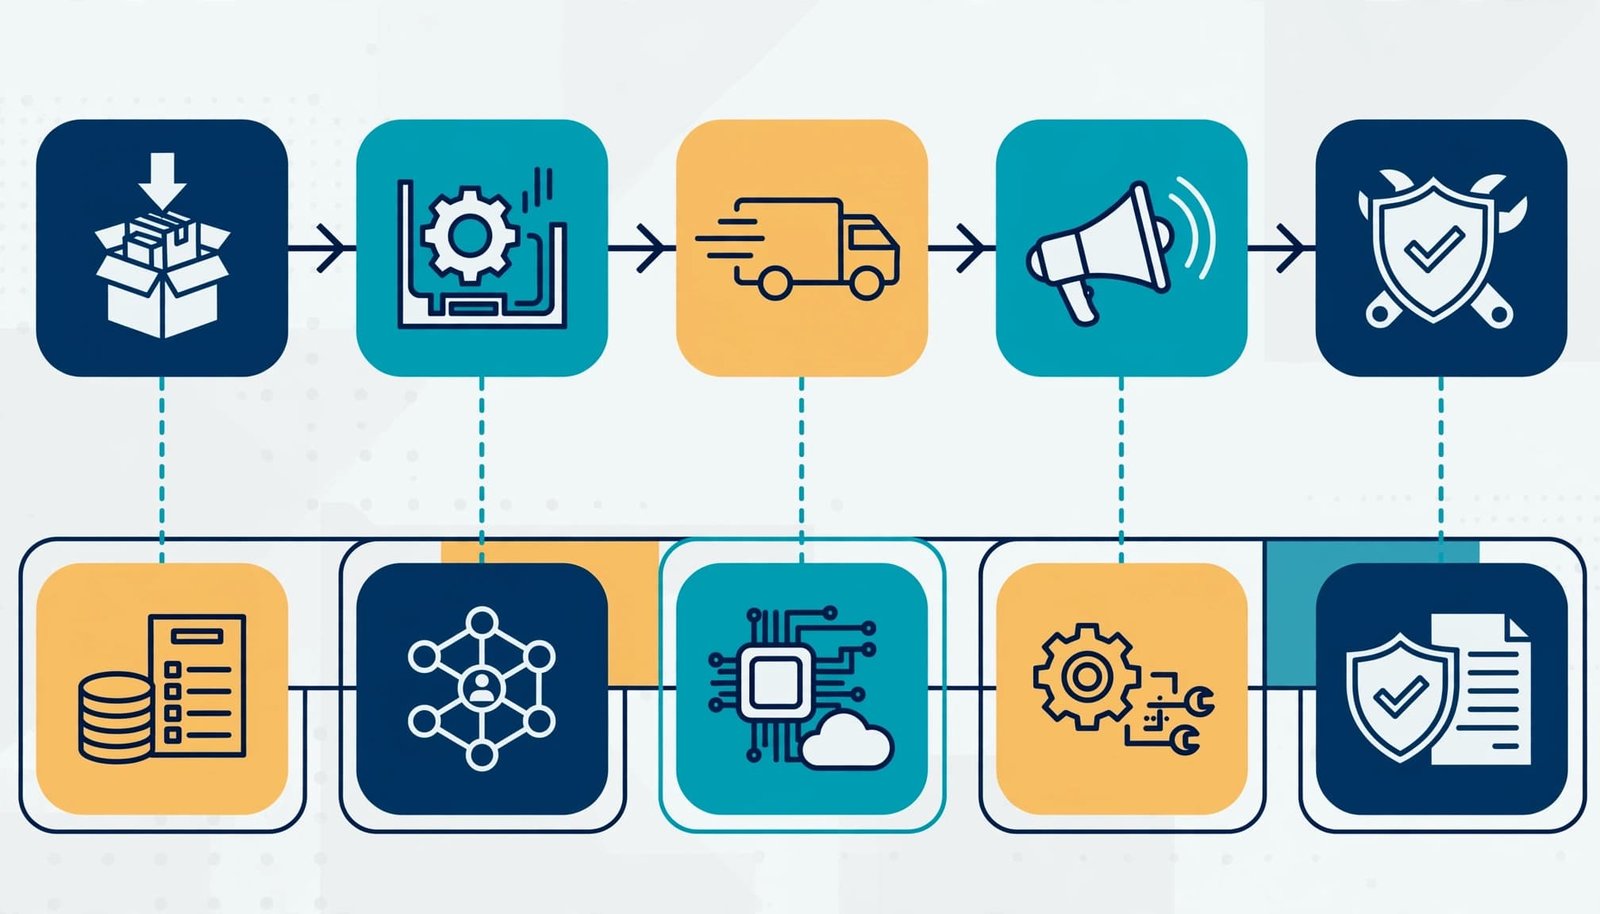
Porter separates the firm into five primary activities and four support activities. In a value chain map, these categories describe work, so they won’t always match the organization chart. Assess the five primary activities as a connected sequence, since each stage affects the next.
The five primary activities
Inbound logistics covers receiving, storing, and handling inputs. For a manufacturer, reliable availability of components and raw materials prevents production interruptions. Operations transforms inputs into finished products or services, where yield and process quality affect value.
Outbound logistics gets the finished offering to customers through warehousing, order fulfillment, and delivery. Marketing and sales helps buyers understand and purchase it through positioning, channels, and selling. Service maintains value after purchase through installation, repairs, training, or support.
For a consulting firm, these primary activities look different: project delivery replaces factory production, while handover and ongoing support carry much of the service role.
The four support activities
Firm infrastructure includes management, finance, legal, and governance. Human resource management covers recruitment, development, and retention. Both influence how reliably the company can deliver its offering.
Technology development includes product engineering, process design, and business systems. Procurement manages purchasing across the business, including equipment and services.
Support doesn’t mean low-value or dispensable. Better workforce scheduling can improve operations, while procurement choices affect input quality and downstream defects. Analyze these relationships before recommending cuts.
Start the analysis: map, calculate, and benchmark
Step 1: Map activities and handoffs
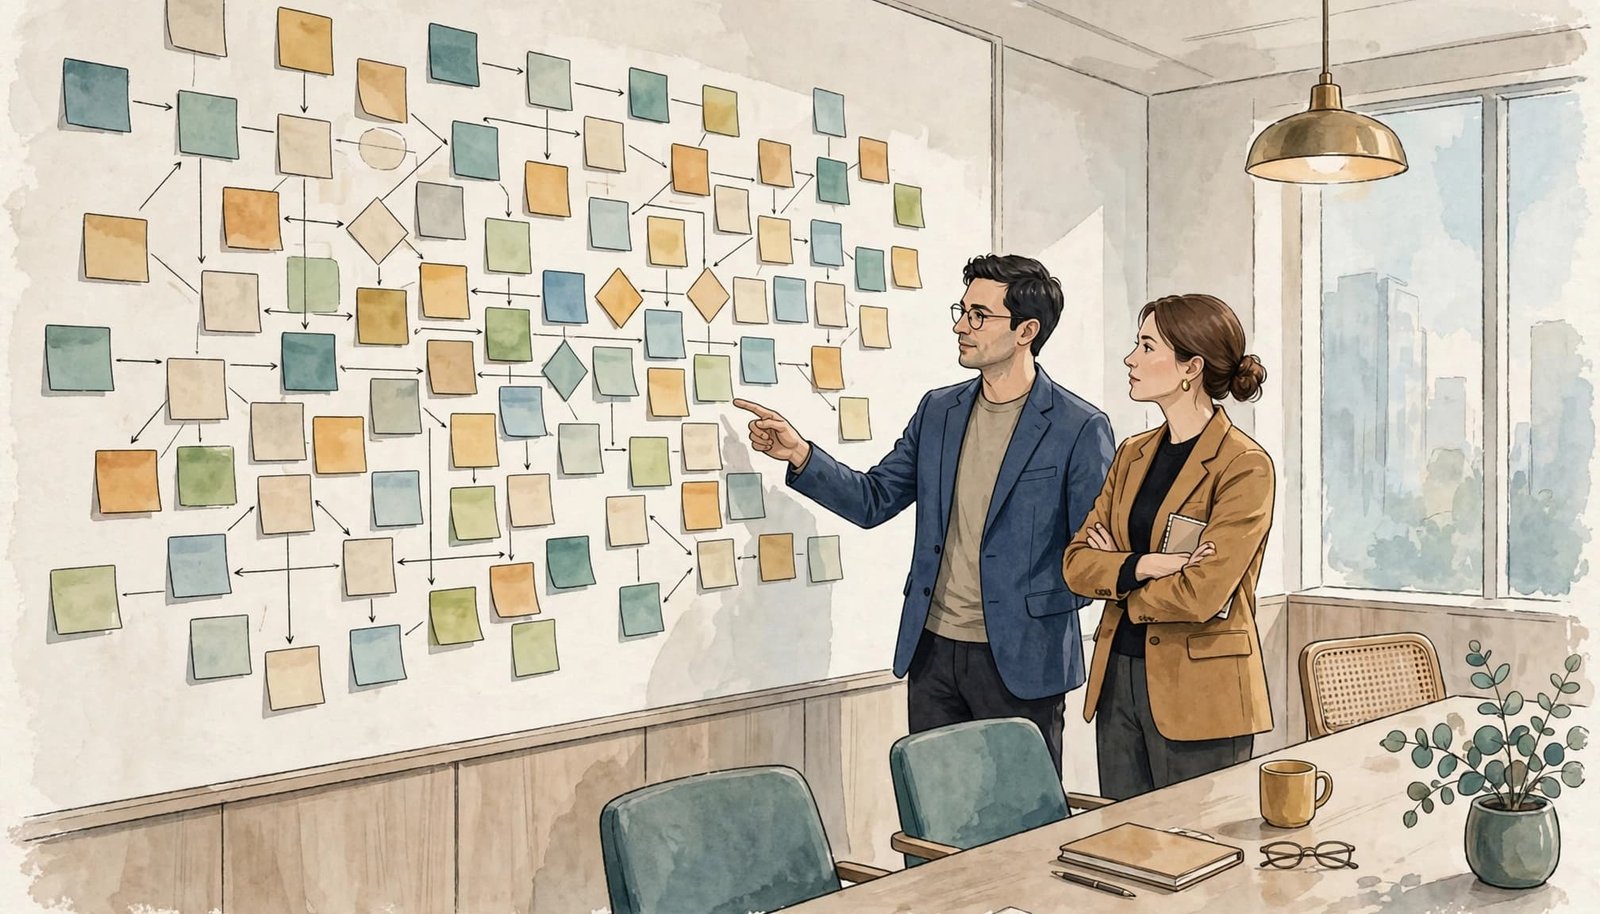
Build the map with operations, finance, commercial, and customer-facing teams. Break broad categories into observable activities, such as receiving stock, approving discounts, or resolving warranty claims.
Then capture inputs, outputs, owners, and handoffs. Ask where work waits, repeats, or crosses organizational boundaries.
A workshop creates a shared description. Validate it against order records, system logs, and direct observation before treating it as the operating reality.
Step 2: Calculate costs and customer value
Use cost analysis to reconcile activity costs with the relevant financial baseline. Include labor, raw materials, technology, overhead allocations, and external services without double-counting shared expenses.
Next, identify cost drivers: order count, handling time, shipment distance, or rework frequency. Separate fixed, variable, and avoidable costs because lower activity volume won’t automatically reduce spending.
Assess customer value separately using buying decisions, retention, complaints, and interviews. A costly activity may support differentiation; a cheap one may create expensive failures elsewhere.
Step 3: Benchmark comparable performance
Use benchmarking to compare cost, speed, and quality with competitors, industry leaders, or internal sites. Normalize measures for product mix, service levels, geography, and scale.
Cost per order means little if one company ships complete baskets while another splits them across warehouses. Where external data is weak, compare internal sites or customer segments using consistent definitions.
Turn findings into strategic recommendations
Step 4: Identify and prioritize improvements
Look for activities that add avoidable cost, constrain delivery, or create differentiation customers recognize. Examine cross-functional effects before ranking opportunities. Test whether process automation removes handoffs or errors, rather than simply shifting work elsewhere.
For each proposal, record expected metric movement, implementation effort, risk, dependency, and supporting evidence. Use client-agreed criteria and attach a rationale to every score that could change the recommendation.
A Value vs. Effort matrix can support discussion, but it doesn’t allocate scarce specialists. Delivery feasibility still depends on available capacity, sequencing, and mandatory work.
A saving in one activity can increase total cost if it creates more defects, returns, or customer contacts downstream.
Step 5: Build an implementation roadmap
Convert priorities into decisions to fund, sequence, defer, or stop. Each initiative needs an accountable client owner, baseline, target measure, delivery milestone, and benefit-review date.
Separate outputs, operational changes, and benefits. A revised routing policy is an output. Staff applying it is a change. Lower fulfillment cost without worse delivery performance is a benefit.
Build a benefits realization plan around those links. Record implementation costs and distinguish forecast benefits from observed results. Use benefit reviews and outcome tracking to guide continuous improvement after implementation.
Finally, compare outcomes with other possible causes. A better metric alone doesn’t establish that the intervention caused the improvement.
Practical example: reducing retail fulfillment costs
For retail fulfillment, trace expedited shipments and split orders across the chain rather than treating freight rates as the whole problem.
Inventory placement starts upstream. Order-routing decisions sit in operations and outbound logistics. Meanwhile, promised delivery dates and customer-service overrides can trigger expensive shipping choices.
Use these relationships to develop targeted recommendations:
| Finding to investigate | Potential recommendation | Measure to track |
|---|---|---|
| Stock sits outside the nearest fulfillment node | Rebalance high-velocity inventory | Complete orders fulfilled locally |
| Routing creates avoidable split orders | Route using complete-basket availability | Shipments per order |
| Overrides trigger unnecessary express delivery | Set approval rules and revise delivery promises | Expedited shipment rate |
| Packaging increases billed shipment size | Review packaging standards | Cost per shipment |
Calculate the financial case using actual order volumes, avoidable shipment costs, and implementation expenses. Assess whether fulfillment savings preserve customer value creation, and track service-level effects alongside savings.
For example, holding an order for consolidation may reduce shipping expense but delay delivery. The client needs an explicit service rule before changing routing logic.
The concrete outputs are an activity-cost baseline, a routing-change proposal, a pilot design, and a benefit-tracking sheet. Without reliable inputs, recommend the pilot and measurement approach rather than inventing a savings figure.
Distinguish value chain analysis from related tools
Choose the framework that matches the decision.
| Tool | Main question | Typical focus |
|---|---|---|
| Value chain analysis | Where do activities create advantage? | Cost, differentiation, and activity linkages |
| Supply chain management | How should supply and delivery work? | Sourcing, conversion, and physical and information flows |
| SIPOC | What are the process boundaries? | Suppliers, inputs, process, outputs, and customers |
| Porter’s Five Forces | How attractive is the industry? | Competition and industry structure |
The CSCMP definition of supply chain management includes sourcing, procurement, conversion, logistics, and coordination across partners. Its operational scope overlaps with the value chain, but the strategic question differs.
SCOR structures supply-chain processes
Developed by the Supply Chain Council, SCOR’s traditional core sequence is Plan, Source, Make, Deliver, and Return. Later versions add or revise process categories.
Use SCOR to organize operational investigation. The current ASCM SCOR Digital Standard supports supply-chain process analysis and improvement. It doesn’t replace Porter’s examination of competitive advantage.
Kraljic supports impact-and-risk classification
Kraljic’s purchasing portfolio model classifies purchases as non-critical, leverage, bottleneck, or strategic according to impact and supply risk.
Consultants can adapt that logic to functions, provided they define the axes and evidence. A high-impact, high-risk function warrants different treatment from routine purchasing. The adaptation remains a decision aid, not proof that outsourcing or consolidation will create value.
Keep transfer-pricing analysis separate
Multinationals also use value-chain mapping for transfer pricing documentation. This work describes how group entities contribute through their functions, assets, and risks.
Under OECD master-file guidance, the supply-chain description covers the group’s five largest products or service offerings by turnover. It also includes other products or services exceeding 5% of group turnover. A chart or diagram can provide that description.
This differs from choosing a cost-leadership or differentiation strategy. A strategic activity map may inform the work, but it doesn’t establish an arm’s-length price or settle profit allocation.
For tax-related engagements, involve transfer-pricing specialists and distinguish legal-entity responsibilities from the operating activities shown on the strategy map.
Key takeaways
- Analyze activity linkages alongside individual costs because local savings can damage total performance.
- Match recommendations to customer value, competitive strategy, and realistic delivery capacity.
- Give every benefit a baseline and owner, then distinguish implementation from measurable business results.
Frequently asked questions
Does Porter’s value chain have four components?
Porter’s framework has nine activity categories: five primary activities and four support activities. References to “four components” usually mean the support categories: firm infrastructure, human resource management, technology development, and procurement. They’re part of the full framework rather than a separate four-stage chain.
Can consultants use AI during the analysis?
Yes. AI can organize interview notes, suggest mapping questions, and draft comparisons from approved evidence. Our practical Claude skills for consultants cover supporting workflows.
Keep facts, assumptions, and inferences separate. Human reviewers remain accountable for internal numbers, customer interpretations, and final recommendations. A polished map doesn’t establish that the underlying evidence is sound.
Make the activity map support a decision
A useful value chain analysis ends with a defensible choice about where the client should invest, improve, or reduce spending. The activity map connects that choice to operational and customer evidence.
Keep the benefit claim traceable through implementation and adoption. That gives the client a recommendation they can act on and a result they can measure.