Cost-to-Serve Analysis: When Consultants Should Use It
Cost-to-serve analysis measures what a customer, product, or channel costs to support, beyond the product’s purchase or manufacturing cost. Consultants use it when healthy gross margins hide weak profitability.
The useful output is an account-level decision, backed by traceable costs. Start by separating delivery economics from accounting averages, since service demands can create profit leakage even when gross margins look healthy.
Key Takeaways
Use activity-level costs to explain profitability, distinguish allocated overhead from avoidable spending, and test service changes before exiting accounts.
What Cost-to-Serve Analysis Measures
Why gross margin misses service complexity
Traditional accounting often spreads overhead by revenue. However, equally sized accounts can require different delivery effort.
Full cost to serve equals direct customer costs + activity-based service costs + allocated shared-service costs. Under this definition, direct costs include product cost.
Reconcile the result to finance’s baseline. Otherwise, freight or labor already included in product costs can appear twice.
Which costs belong
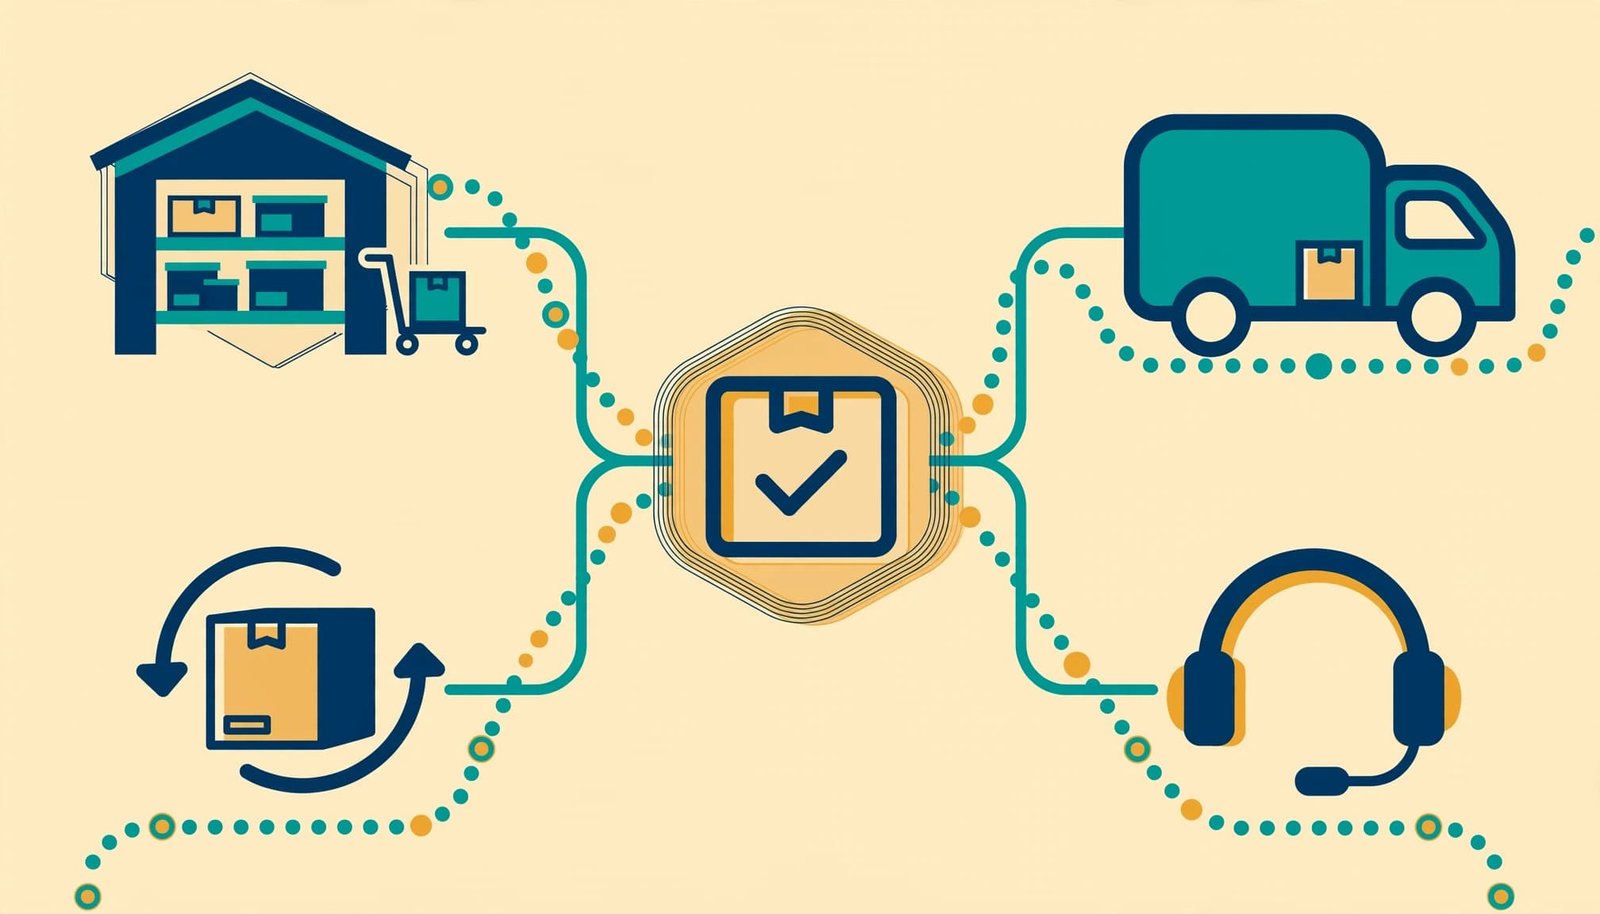
Include order processing, warehousing activities and warehousing costs, picking and packing, freight, returns management and reverse logistics, customer support, promotions, rebates, and inventory carrying costs. Capture payment-term costs where material.
Treat rebates as either revenue reductions or costs, never both. Also separate fixed, variable, and avoidable costs: fewer orders won’t automatically reduce warehouse rent.
Build a Model the Client Can Inspect
Gartner recommends six steps for cost allocation, with indirect costs and overhead assigned according to customer and product complexity:
- Map cost components.
- Agree the scope.
- Connect costs to operational cost drivers.
- Calculate activity rates.
- Reveal transaction-level profitability.
- Apply the findings.
Our value chain analysis guide helps map activities before assigning costs.
Choose the method and collect data
Activity-based costing (ABC) allocates costs through activities. Time-driven activity-based costing (TDABC) uses capacity cost per minute multiplied by handling time.
Excel suits an initial model; ABC and TDABC are methods, not competing software options. Network design modelling software suits complex transportation, production, and warehousing scenarios.
Request ERP invoices and product costs, WMS picks, TMS shipments, CRM contacts, returns, rebates, timesheets, and general-ledger balances. Keep stable customer and order identifiers.
Allocate costs using operational drivers
Use orders for order-entry costs, lines for picking, pallet-days for storage, and delivery stops or distance as drivers of transportation costs. Revenue rarely explains operational workload well.
Cost per activity = cost rate per unit x quantity consumed.
Total cost to serve can therefore equal product cost plus summed activity costs across service channels, provided those pools capture all remaining direct and shared costs.
When data is missing, use observed samples or documented estimates. Test sensitivity and reconcile totals. Keep unknowns distinct from zero, and retain formulas, source records, and assumptions.
A Worked Example: Small Orders, Expensive Delivery
The cotton-gloves case shows how shipment size changes economics. A $5 product incurred roughly $7 in freight costs for overnight courier delivery, creating a $12 delivered cost.
With five pairs sharing the same $7 shipment:
Freight per pair = $7 / 5 = $1.40.
Delivered cost per pair = $5 + $1.40 = $6.40.
A minimum order quantity of five pairs reportedly restored profitability. These figures don’t establish the margin percentage because they omit the selling price and other service costs.
When Consultants Should Use Cost-to-Serve Analysis
Use profitability analysis during pricing reviews, channel redesign, contract renegotiation, or unexplained margin erosion to guide pricing decisions. Small, frequent orders deserve attention because processing and delivery costs recur with every shipment.
Reported analyses find that 20% to 40% of orders are unprofitable after service costs. A common whale curve shows roughly 20% generating profits, 60% breaking even, and 20% losing money. Treat these proportions as patterns, not targets.
In Auxis’s CPG example, the highest-sales customer generated the lowest profit because logistics costs for delivery and returns were high.
Logistics Bureau’s supply-chain cases offer evidence about supply chain profitability. An Australian consumer-goods business saw 30% of products suffer margin erosion before delivery. A Thai distributor saved about $10 million annually after addressing poor fleet utilization.
Scoop describes an HVAC distributor shifting marginal accounts to a self-service eStore. An electronics distributor reduced order-processing time by 80% through automated order entry.
Turn Customer Segmentation Into Decisions
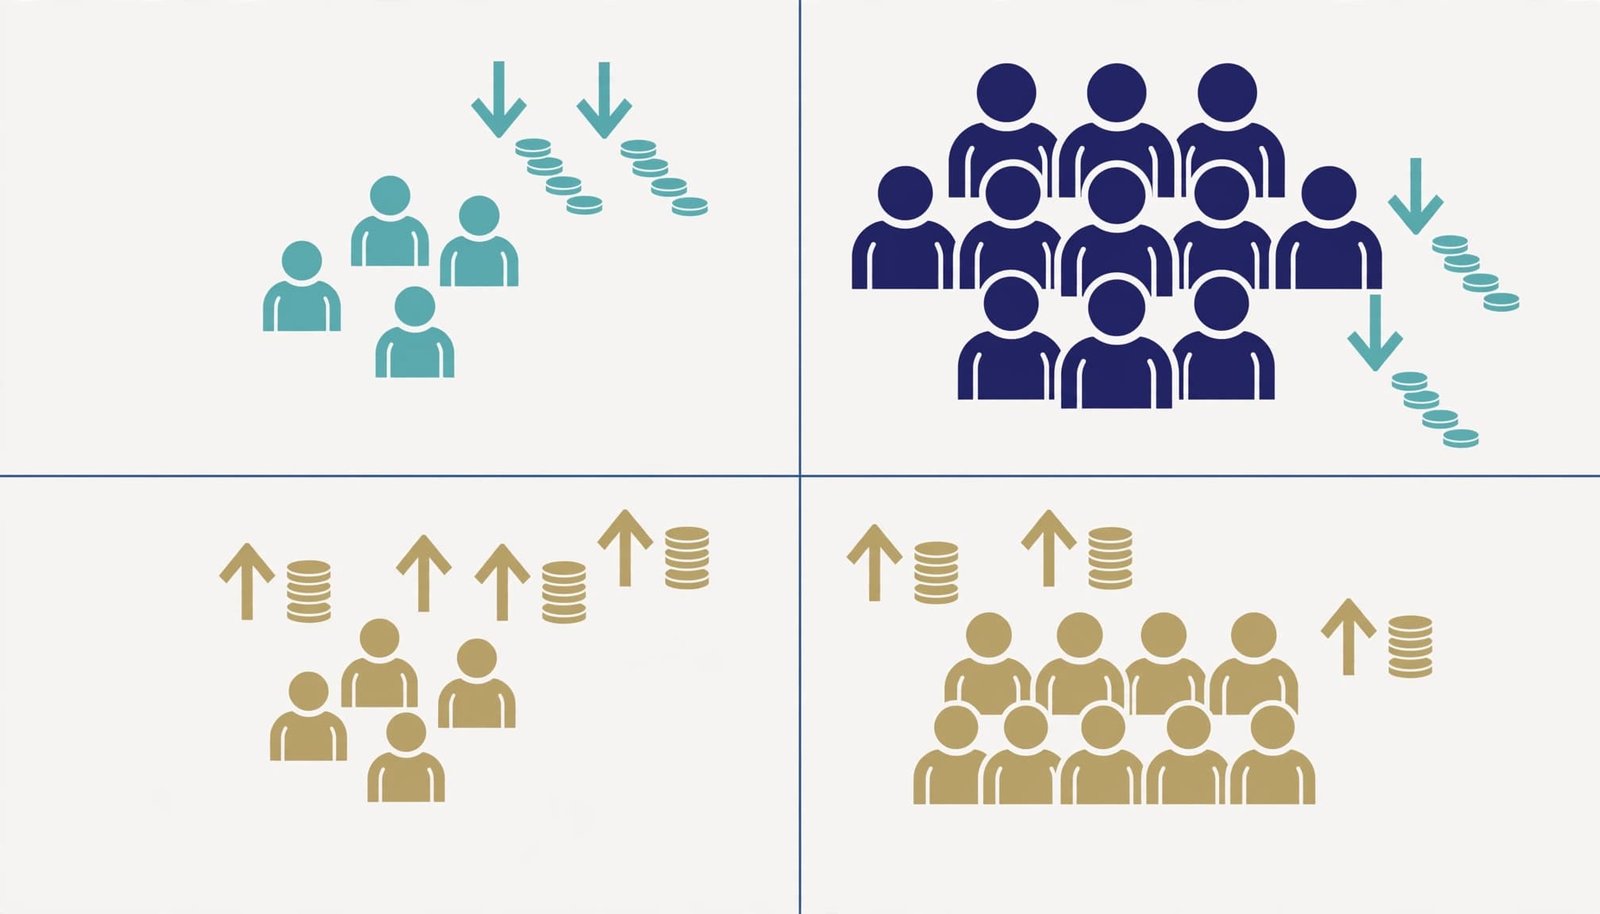
Use revenue and service cost to guide customer profitability analysis and identify accounts for further investigation.
| Revenue | Cost to serve | Starting action |
|---|---|---|
| High | Low | Protect and grow |
| High | High | Restructure service and contracts |
| Low | Low | Develop through efficient channels |
| Low | High | Reprice, consolidate orders, or consider exit |
These quadrants guide decisions; contribution and customer value determine the recommendation.
Allocated losses don’t equal recoverable savings. Exiting an account can leave fixed costs behind while removing revenue.
Use continuous cost-to-serve monitoring to track cost per order, cost per customer, cost-to-serve ratio (service costs divided by net revenue), returns rate by account, and manual-touch rate. Monitor retention alongside savings.
FAQ
How often should consultants refresh the model?
Refresh it when prices, order patterns, service terms, or operating costs change materially. Monthly monitoring suits recurring decisions.
Can AI build the analysis?
AI can organize approved records and explain patterns. Keep reproducible calculations in an inspectable model, and retain human approval.
Make the Recommendation Financially Defensible
Cost-to-serve analysis earns its place when it connects customer behavior to delivery effort and a commercial decision.
Recommend changes around avoidable costs and customer value. A defensible proposal shows which costs change, which remain, and how the client will measure the result.